Geo-Surface Main Functions A-Z
Automatic Connection Detection

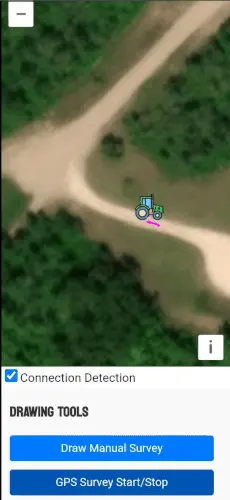
With the Connection Detection feature enabled (it is enabled by default), Geo-Surface Designer simplifies connecting drainage lines. When you start drawing a new profile within about 30 feet of an existing one, the system automatically identifies it as a lateral and connects it to the existing line, treated as a main. This eliminates guesswork and manual adjustments, ensuring your intended connections are recognized from the start.
Once both the main and lateral have grade lines (best fit or manual), Geo-Surface validates the connection. A green highlight in the line list confirms the connection is at a workable elevation, while a red highlight signals that adjustments may be needed—such as deeper cuts or tweaks to grades. Even with a red status, you can explore options like adjusting depths or rerouting to make the design feasible.
This feature provides instant feedback and clear visuals, helping you design smarter, more integrated drainage systems with less effort and more confidence.
Best-Fit Profiles Modeling
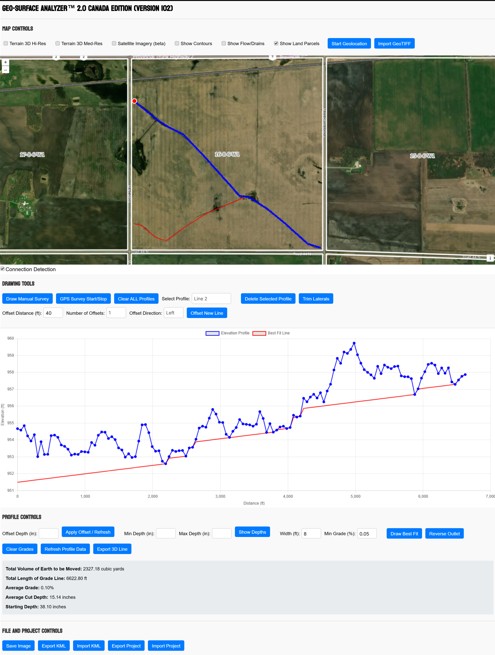
If you’ve embraced modern machine control, you’re likely familiar with its best-fit function—drive your route with RTK, and the grade control system instantly calculates a best-fit slope that maintains your specified minimum grade. This streamlines drainage projects, removing guesswork and ensuring every run is practical and efficient. But why wait until you’re in the field and risk wasting time and money driving around trying to figure out the best routes?
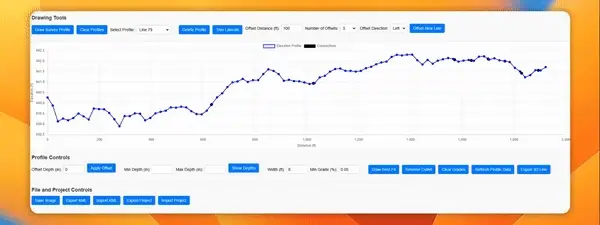
With GSA 2.0, you can simulate this exact process ahead of time, right from your desktop. After you’ve drawn a Survey Profile (proposed drain route) on the map, you can select two points—usually the run’s start and end—and let GSA 2.0 automatically compute a best-fit grade profile. The software then provides critical insights: material volume, average cut depth, starting depth, and total run length. Armed with this knowledge, you can confirm that your plan is both feasible and cost-effective before ever breaking ground. Plus, if the system initially treats the highest point as the inlet and you prefer the opposite, a quick click of “Reverse Outlet” adjusts the scenario instantly.
In essence, GSA 2.0’s best-fit technology acts like a virtual grade control operator, ensuring that what looks good on paper actually translates seamlessly into the field—saving you time, money, and hassle.
Click to View Elevation
 With GSA 2.0, getting an instant elevation reading at any location is as simple as a single click on the map. When you click on a point where high-resolution LiDAR data is available, the tool immediately retrieves and displays the elevation for that exact spot. This rapid, on-demand elevation insight transforms the way you plan and validate drainage strategies.
Imagine being unsure of how to route a drain or deciding if a certain low-lying area can be connected to a particular outlet. Just a quick click provides the elevation data you need to visualize and compare inlet/outlet heights. It helps you spot subtle elevation differences that may not be obvious from contours or overhead imagery alone. By effortlessly pinpointing elevation details, you can confirm the feasibility of proposed drainage lines, identify potential blockages, and ensure that each run will work as intended in the real world.
In short, the single-click elevation query streamlines the critical step of understanding your landscape’s vertical dimension, allowing you to make informed decisions with greater confidence and accuracy.
Contour Mapping
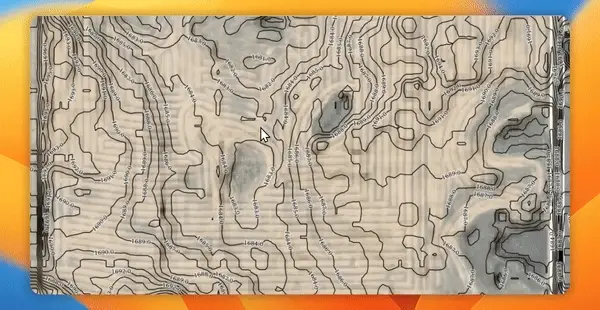
In most areas GSA 2.0 can overlay contour lines directly onto your map to help give you a clear visual representation of how the land rolls and dips. Detail and resolution of contour layers varies by region.
Drainage Flow Mapping
 For a growing list of regions in Western Canada and the United States (with slightly less detailed options for the UK), our flow maps visually reveal how water naturally moves across your fields. By following these pre-existing drainage patterns, you can often design lines that “fit” the land better—resulting in more reliable validation and shallower excavation.
NEW: In areas covered by LiDAR you can now compute much higher detail flow lines for your specific fields! See HD Flow Maps for more info
Draw Survey Profile (Virtual Survey)
 With Geo-Surface Designer, you can chart out a potential drainage path right from your screen—just hit the Draw Manual Survey button, then click, touch, or draw with a stylus to trace a proposed drain route. Instantly, the system retrieves detailed elevation data at set intervals along that path (the spacing depends on the route’s total length, ranging from points on the ground every 5 to 20 feet). This transforms abstract maps into highly visual, easy-to-understand elevation profiles.
The immediate advantage is clear: instead of spending hours guessing and adjusting in the field, you can perform a virtual survey first. This upfront insight helps you determine whether a particular drainage layout makes sense—identifying potential trouble spots, depths, and slopes before a single shovelful of earth is moved. While it’s not a replacement for final, on-the-ground verification, this powerful preview can significantly cut down on trial and error in real-world conditions, saving both time and money. It’s like having a preliminary blueprint that guides you toward the most workable, efficient solutions—ensuring that when you do hit the field, you hit it with a well-informed plan.
Geolocation
 GSA 2.0’s geolocation feature bridges the gap between office planning and real-world application. By using a GPS-enabled tablet directly in the field, you can pinpoint your exact position on the map with precision. This capability allows you to adapt on the fly—if you’re currently standing at a problem spot, you can design a drainage solution right there and then, based on the terrain and your observations. Alternatively, you can create an entire drainage plan at your PC first, then bring it into the field on your tablet as a reference guide. Whether you’re scouting new drainage lines, verifying an existing design, or comparing real conditions to your planned layout, geolocation ensures that everything you see on the screen corresponds directly to what’s under your boots. It’s a powerful, location-aware tool that makes the step from concept to execution more efficient and confident.
Export 3D Line Data
With a single grade line selected, you can export the data for use in other software or to import into a grade control system (although we recommend you use RTK to survey proposed runs rather than installing based on the LiDAR for a host of reasons). Currently, single lines can be exported as CSV formatted values containing Latitude, Longitude, Survey Elevation, and Design Elevation columns, as well as Ditch Assist specific formats XYZP Design (for implementing your GSA 2.0 design without surveying), and XYZ Survey (replicates a driven survey with Ditch Assist and is ready for loading into Slope-IQ to create a best fit design without driving the survey. In all cases, make sure you understand the risks and limitations here, and if installing based on LiDAR, you will likely need to calibrate your RTK equipment to correctly align with the LiDAR data. If you have additional requirements, we may be able to add additional export formats.
Export/Import Flow Routes to KML
This feature lets you save a generated flow route layer as a KML file for use in other mapping software or as an overlay in systems like Ditch Assist.
Once you've saved a flow routes layer, you can easily re-import it in future sessions without having to regenerate it, saving time and avoiding the wait for new processing.
GPS Virtual Survey
 Use your phone or an internet-connected tablet in the field to test your theory that a particular drainage route is viable! Enable GPS Survey, then walk or drive the proposed route. The route you record is saved as a survey profile route, just like if you'd drawn it on-screen. GSA 2.0 will fetch the elevation profile of the route, and you'll be able to use it just like a drawn profile.
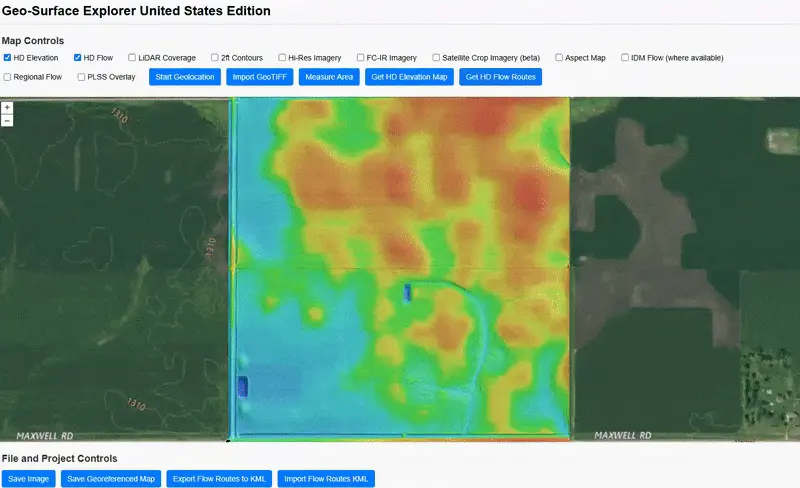
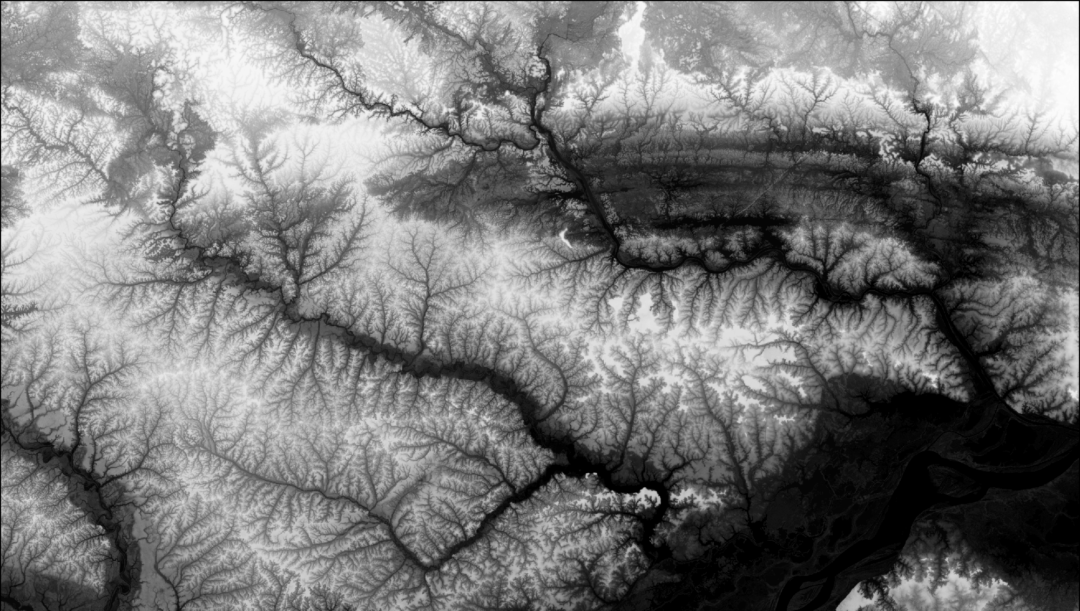
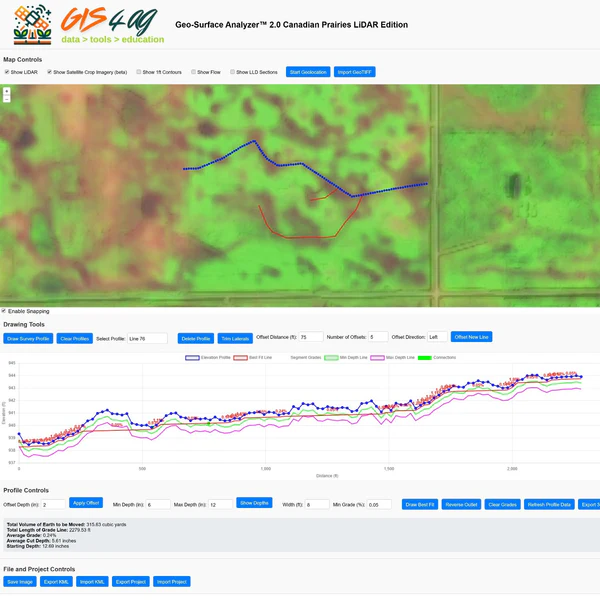
HD Elevation (3D Colorized Terrain Mapping)
HD Flow Routes (Generate your own Flow Maps)
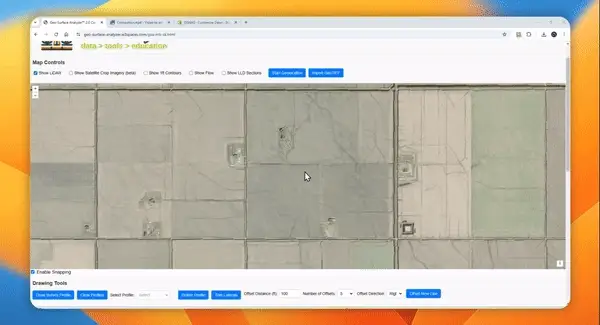
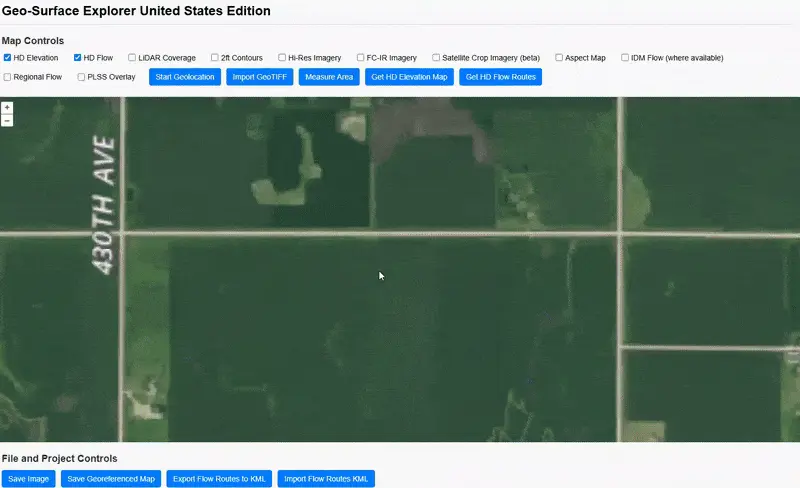
 Geo-Surface Explorer and Designer now offer on-demand detailed flow route generation for all regions with LiDAR coverage, including the entire U.S., a growing number of areas in Canada, and all of England, UK. To generate flow routes, use the "Get HD Flow Routes" tool and draw around your Area of Interest (AOI), ensuring it remains under 1,500 acres. For the best results, outline your field or section while staying inside the roads unless there are open channels, as LiDAR cannot detect culverts, which may affect accurate flow modeling.
Once submitted, the tool first fetches high-resolution LiDAR for the AOI and uploads it to a processing server running advanced GIS software. The server then performs over 10 transformations on the LiDAR data to compute highly detailed and accurate flow routes, which are then downloaded back into your browser and displayed on the map.
This is an advanced feature, and occasionally, the process may time out or encounter an error before completion. If this happens, try again in a few minutes. If the issue persists, wait an hour and retry, as server-related issues often resolve themselves once a stuck process times out. If processing fails on a large area, such as over 640 acres, try reducing the AOI size per request for better reliability.
Import/Export KML Layers
Export KML allows all currently drawn profile lines to be exported as a single KML file. KML files can be imported into grade control systems like Ditch Assist to use as a reference (know where to go to implement your design), opened in Google Earth, or used to create a custom Google Map using MyMaps (it's free and very cool). You can also easily convert KML to other formats line shapefiles using open source GIS software like QGIS (training on this is provided in the included online training materials).
Import KML allows you to load KML line features and use them as grade lines. Once loaded, the program will attempt to download elevation values for the lines so thay can be used as profiles.
Import/Export Drainage Design Projects
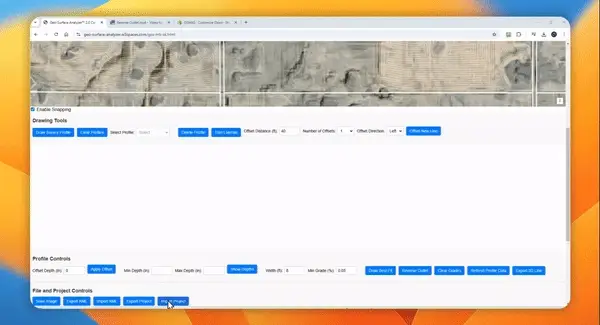 GSA 2.0 is built for flexibility and portability. With the ability to export your entire workspace into a single JSON file, backing up every detail of your drainage project is simple. This includes everything from Survey Profiles and their precise elevation data to your Grade Lines—whether manually set or optimized with Best Fit—and even the connection points between laterals and main drains. All of it is neatly packaged in a portable, shareable data file.
This feature isn’t just a safeguard against computer crashes; it’s a game-changer for planning. You can create your designs on a desktop in the office, save the project as a JSON file, and then load it onto a tablet or laptop to take into the field. With geolocation enabled and your complete design in hand, you can verify drainage routes, check depths and grades, and make adjustments on-site without losing any of your work.
The Export/Import Project tool transforms GSA 2.0 from a static desktop program into a dynamic, on-the-go solution. It saves time, reduces hassle, and ensures your work is always accessible, whether you're at your desk or out in the field.
Import GeoTIFF Elevation Data
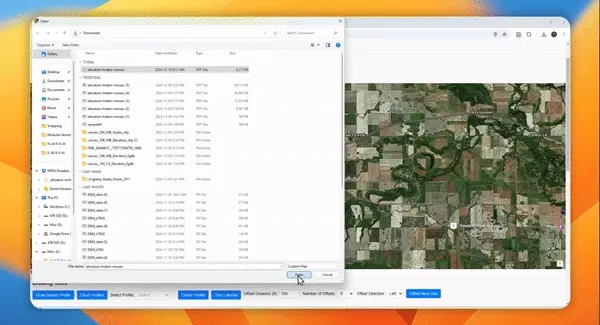 If you have your own elevation data—perhaps from a drone survey, an RTK-equipped tractor, or a newly acquired LiDAR dataset—you can integrate it directly into GSA 2.0. By importing a properly formatted, single-band, EPSG 4326-referenced GeoTIFF, you can substitute the default online LiDAR data with something more tailored to your operation. This is especially valuable if you’ve invested in a private survey or have access to rare, high-resolution data that isn’t yet available through our servers. Not only does this feature give you full control over the data source powering your designs, it also means you can leverage cutting-edge local information to ensure that GSA 2.0’s drainage suggestions are as precise and site-specific as possible. If you need help converting your data into the required format, we offer services to process various data into the required format.
LiDAR Data Enabled
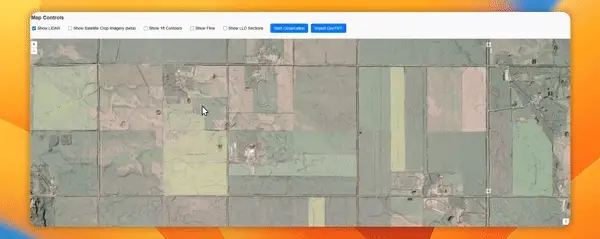
 GSA 2.0 simplifies access to high-quality elevation data by integrating directly with a cloud-based GIS server. With coverage spanning over 250 million acres across North America and all of England, many producers can skip the need for field surveys and dive straight into drainage planning. This instant access to high-resolution LiDAR data offers a detailed view of the landscape’s contours and water flow patterns.
By eliminating the need for expensive surveys, this approach lowers upfront costs, speeds up the planning process, and ensures that your designs are built on the most accurate terrain models available. As LiDAR coverage continues to grow, even more regions will benefit from this advanced, ready-to-use data. With GSA 2.0, you’re not just relying on elevation data—you’re leveraging a constantly updated resource that helps you stay ahead in optimizing field drainage and land management.
Manual Grade Lines
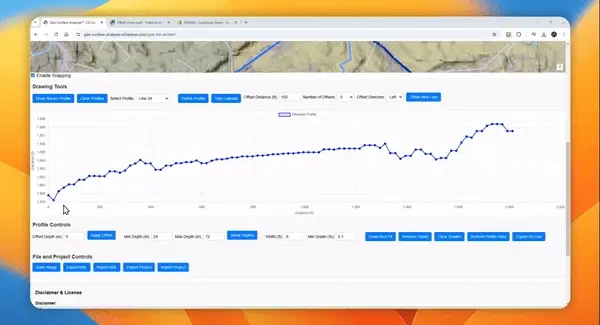 Not every drainage scenario needs the complexity of a best-fit curve. For simpler setups—like using an excavator or laser level—GSA 2.0’s manual grade line tool is the perfect solution.
After drawing your Survey Profile, just click two points on the profile chart to see the grade percentage and create a connecting grade line. Add more points as needed to shape a custom slope that matches your specific needs, whether it’s a consistent grade, a gentle break near the outlet, or something in between.
This hands-on feature gives you complete control, letting you design drainage slopes that align with your tools and methods—all with simplicity and precision.
Measure Area
This simple tool allows you to quickly measure an area and see how many acres it it. Useful when determinging tile sizes for example as you can measure the area to be drained, and combine this with the average grade of the main line, then use a tool like the one on this page to determine required pipe size!
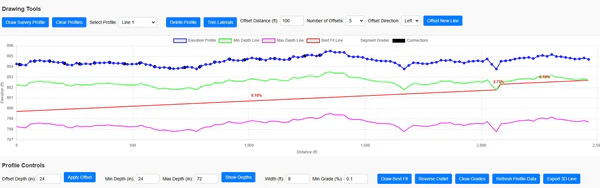
Min and Max Depth Guides
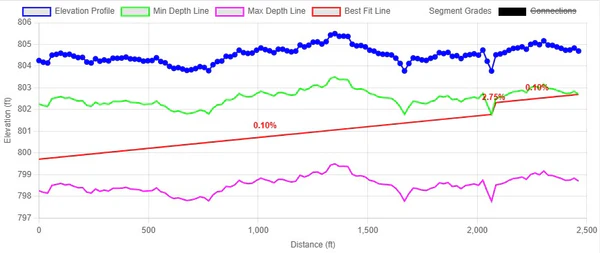 GSA 2.0 lets you set custom minimum and maximum depth lines—displayed in inches—right on your profile graph, giving you a clear view of how shallow or deep your drains will run along their entire route.
For surface drains, you might set a minimum depth of 3 inches and a maximum of 12 inches. Any section exceeding 12 inches highlights areas needing significant excavation, helping you plan for challenging cuts before heading to the field.
For tile drainage, these depth limits are even more critical. For example, setting a minimum depth of 24 inches to avoid damage from heavy equipment and a maximum of 72 inches for your tile plow ensures your design stays within operational limits. This practical approach aligns with your equipment’s capabilities and protects the long-term integrity of your drainage system.
Minimum Grade (for Best-Fit designs)
When using Best Fit (see section on Best Fit), this is the minimum grade you would accept where following the natural terrain slope would not work. As an example, for surface drains you may use 0.05% or 0.04% as a minimum, while for tile you'd likely opt for 0.1%.
Offset Depth
 Once a Grade Line is established, GSA 2.0 allows you to apply a depth offset, adjusting how far the drain sits below the surface. This is especially useful for tile drainage, where maintaining a consistent minimum depth—like 24 inches or more—ensures proper function and durability. Offsets also help accommodate deeper tile mains to connect lateral lines without disrupting flow.
Depth offsets are just as beneficial for surface drains. For instance, a main surface drain may need extra depth for added capacity or to allow lateral connections above its base. By applying offsets, you gain the flexibility to meet the specific structural and capacity needs of your project, ensuring a design that works efficiently and effectively.
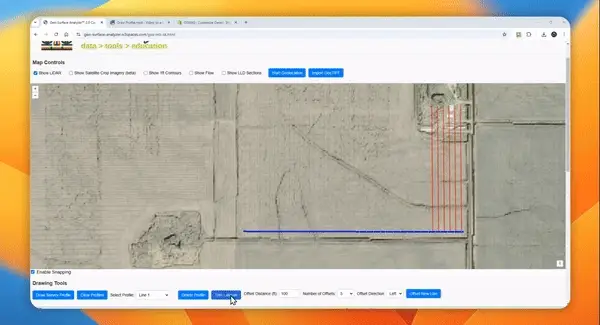
Offset (Create) New Line
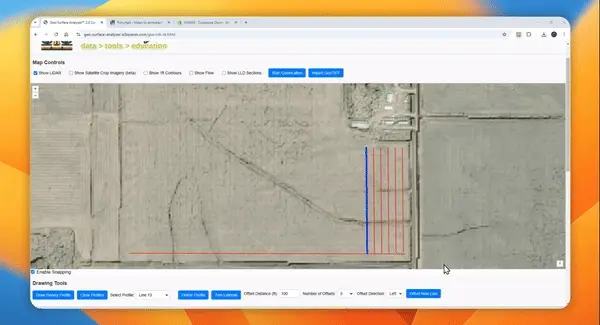 Efficiently planning tile drainage often involves creating multiple parallel runs at regular intervals for uniform water management. GSA 2.0’s Offset New Lines tool streamlines this process, allowing you to generate evenly spaced lines (e.g., every 50 feet) from an existing run. This feature simplifies laying out tile patterns, ensuring consistent and effective drainage across the field.
To maintain performance, GSA 2.0 limits batch creation to five lines at a time. Need more? Simply select the new lines and repeat the offset process as needed to complete your pattern. This method keeps your workflow organized and efficient, making it easy to design a well-spaced, fully functional tile drainage system.
Reverse Outlet (Best-Fit)
GSA 2.0’s Best Fit feature automatically identifies the highest and lowest points as the inlet and outlet, but real-world conditions don’t always follow the ideal pattern. Soil build-up along fence lines, ridging from years of tillage, or a deeper-than-expected pothole can shift assumptions about the true high and low points.
In some cases, the point identified as the “inlet” may actually be lower than the “outlet.” That’s where the Reverse Outlet function comes in. With a simple toggle, you can switch the inlet and outlet assignments, ensuring the Best Fit calculation aligns with the actual flow direction you need.
This feature provides the flexibility to adapt your design to real-world terrain, making your drainage layout more accurate and responsive to your land’s unique challenges.
Satellite Crop Imagery (beta)
 GSA 2.0 is breaking new ground in drainage diagnostics with the integration of seasonal satellite imagery. This experimental feature retrieves recent crop-season images, enhanced to highlight areas prone to waterlogging or poor drainage. By identifying these stress zones visually, you can confirm known issues or uncover hidden problem spots affecting yields.
As a beta feature, access may occasionally be limited, and reliability can vary. However, when available, this tool provides valuable insights, connecting field observations with real-time data. By incorporating satellite imagery into your workflow, GSA 2.0 helps you make smarter, data-driven decisions to improve field conditions and boost productivity.
Save Georeferenced Map
Clicking this button will generate a georeferenced image of the current map view. You will receive two files for download—a JPEG image and a JGW world file containing georeferencing information. The first time you do this, your browser may ask for approval, as most browsers block multiple downloads by default.
To use these files in GIS software, ensure they are saved together in the same folder. When importing into your software, select only the JPEG file—the georeferencing will be applied automatically. The coordinate reference system (CRS) is WGS84 (EPSG:4326). In QGIS, if the image does not align correctly, click the ? icon next to the layer and manually set the CRS.
For Ditch Assist, save both files (JPEG and JGW) in the same folder on your tablet, such as the Downloads folder. Then, in Manage Layers > Add > Image File, long-press both files to select them and add them to the map. The image will appear as an overlay on the Ditch Assist screen, allowing you to see exactly what you were viewing in Geo-Surface.
Save Image Screenshot
 Save a high quality JPEG image of the entire page (not just what you see). Useful if you need records of specific drain runs showing the map view, profile, and all settings and statistics applied to that run.
Trim Laterals
When drainage runs become unwieldy—especially after using the Offset New Line feature—GSA 2.0’s “Trim Lines” tool makes cleanup simple. Just draw a line across a surveyed run, and the software automatically splits it into two segments, removing the shorter piece. This precise trimming helps you tidy up your design with minimal effort.
With this tool, you can quickly refine your drainage layouts, eliminating unnecessary segments to keep your profiles focused and manageable. It’s an easy way to maintain clarity and streamline your workspace, ensuring your designs are clean, efficient, and ready for analysis.